Welcome
Professional Weather Insights for You
reduce risk by understanding weather impacts and threats
reduce risk by understanding weather impacts and threats
View here - issued August 19, 2026
At Weather Echo LLC, through a trusted relationship, we provide expert weather and climate interpretive services. Our mission is to empower and educate individuals and businesses with accurate information for decision making.

Our collaboration with core partners includes all sectors.


ENSO El Niño, a natural cycle of warming of the ocean along the equator, can be monitored daily using satellites and buoys (image from July 27, 2026). El Niño is the warming of the water along the equator and NOT precipitation, a series of storms, or a jet stream. The warmer water can add energy to the atmosphere and enhance the existing weather patterns and jet streams, but where these storms move to is highly uncertain from month to month during the cool season. The same energy can support stronger tropical cyclones in the Pacific Ocean during the warm season.
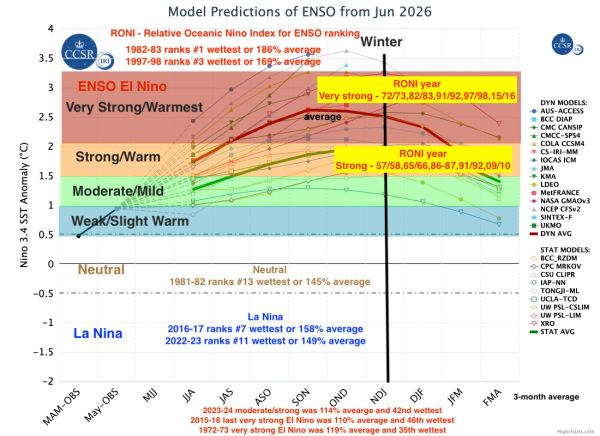
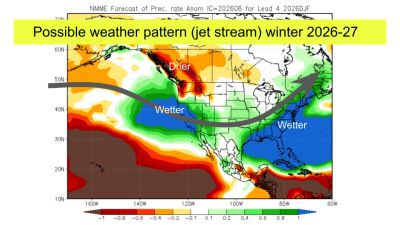
ENSO El Niño is normal and occurs every 3 to 5 years. A strong El Niño ocean condition is predicted for 2026-2027, which creates unusually warmer water along the equatorial Pacific. El Niño is not a storm or excessive precipitation pattern, however, given El Niño and a normal winter jet stream (100-300 mile wide corridor), combined can enhance the storm track leading to more active weather anywhere for a portion of the 1,400 mile long West Coast. It can also reduce tropical cyclone activity in the Atlantic while increasing hurricanes in the Pacific.

This table displays the top (wettest) California statewide precipitation by winter season. The average total is derived by including all climate zones (mountains, deserts, coast and valleys). The period from November to April is used since it is the core of the rainy season or active jet stream. The season total is compared against a 30 year average (1990 to 2020). While the wettest years on record were El Nino espisodes there are also La Nina years such as 2016-17 that produced excessive precipitation. This is not a measure of individual storms or atmospheric rivers. El Niño, Neutral and La Niña oceanic conditions can produce any type of storm cycle. The very strong El Niño of 2015-16 was ranked 46th wettest, only slightly above average.

Why can't we use an analog (past history) and know what to expect with a given strength of El Niño conditions? While this appeared to have been an effective predictor for the 1997-98 El Niño (understanding 1982-83), the global ocean and atmospheric conditions are not the same in 2026, largely having observed significant warming (e.g., marine heat waves and record land temperatures) since 2000. This map depicts all ENSO El Niño winters that were ranked strong and very strong, compared to the most recent 30 year averages. The green and blue shaded basins indicate these regions were wetter than average and the yellow and orange were drier than average. However, individual seasons such as 2015-16 super El Nino were drier than average in the same green and blue shaded areas such as California. but very wet for Pacific Northwest, meanwhile 2016-17 and 2022-23 were equally or even wetter in California than the average El Niño season. El Niño is NOT precipitation and is not an atmospheric weather pattern but rather a sea surface temperature condition along the Equator. Therefore, the analog or historical comparison is only a simplified approach to the prediction of the storm track and the tangible weather impacts associated with precipitation and temperature.